Bittensor's Rebound: A Statistical Anomaly or a True Bottom?
The crypto market is a bloodbath. As I write this, the screens are glowing red with over $19 billion in liquidations—a systemic deleveraging event that has wiped out hopeful longs and vaporized portfolios. In this sea of carnage, standard procedure is to look for correlations, to see how the entire asset class moves in lockstep as fear takes the driver's seat. And yet, one asset is refusing to follow the script. Bittensor (TAO) is not just holding its ground; it’s staging a defiant rally.
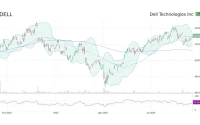
While the broader market capitulated, TAO’s price chart printed a recovery to the $450 resistance level. This isn't just a minor bounce; it's a statistical outlier so significant that it has prompted analyses like Here’s Why the Bittensor (TAO) Price Recovered From the Crash And Hit $400. The market is giving us a clear signal of divergence, and my job is to determine if that signal is genuine insight or just noise. Is this the market identifying a fundamentally undervalued asset amidst the panic, or is it merely a sophisticated bull trap luring in capital before the next leg down?
Let’s be clear: price action like this, in this specific environment, is exceedingly rare. It’s the equivalent of watching a single stock soar on a day the Dow Jones drops 1,000 points. The first question any rational analyst asks is: why?
Deconstructing the Breakout
To understand the mechanics of this move, we have to look at the chart. The data is unambiguous. Last week, as panic selling accelerated across the board, TAO’s chart formed a classic bullish engulfing candlestick. For the uninitiated, this is a powerful reversal signal where a single day’s green candle completely "engulfs" the previous day's red one. It occurred right at the critical $300 horizontal support area, a level that had to hold to prevent a complete price collapse. The candle even had a long lower wick, dipping to $245, which indicates that buyers aggressively stepped in to absorb the selling pressure. That wasn't just a drift upward; it was a violent defense of a key price level.
The subsequent move was even more significant. TAO broke out from a diagonal resistance trend line that has been in place for 308 days. This isn't some arbitrary line drawn on a chart; it’s a long-term barrier (a line connecting the declining peaks over the past year) that has capped every previous recovery attempt. A breakout from such a well-established trend is a structural change in market behavior.
Supporting this move are the standard momentum indicators I use to validate price action. The Relative Strength Index (RSI) has decisively crossed above 50, signaling that buying momentum is now in control. Simultaneously, the Moving Average Convergence/Divergence (MACD) has printed a bullish cross. Taken together, these data points paint a technically coherent picture of a reversal. The question, of course, is whether a technically sound picture can survive in a fundamentally broken market. Are these indicators simply reflecting a temporary, isolated squeeze, or are they the first tremors of a genuine, sustainable trend change?

The Elliott Wave Conundrum
Now, this is where my analysis hits a point of contention and requires a wider lens. While the short-term indicators are screamingly bullish, the longer-term structure suggests a more complicated narrative. The price of TAO fell by over 75%—to be more precise, a 77.5% drop from its December 2024 peak of $744 to the April low of $167. A decline of that magnitude rarely resolves itself in a simple, V-shaped recovery.
Using Elliott Wave theory as a framework for mapping market psychology, the most probable count suggests TAO is in the midst of a large-scale A-B-C correction. The initial crash from $744 was Wave A. The current rally, as powerful as it is, is likely Wave B. In this model, a Wave B rally is often called a "sucker's rally" because it's designed to convince participants that the worst is over, right before Wave C begins and takes the price to a new low, potentially below the $167 mark.
This rally is like a perfectly constructed arch in a building slated for demolition. The arch itself is strong, well-engineered, and can bear a significant load. But it exists within a structure that is fundamentally compromised and scheduled to come down. The strength of the arch doesn't change the fate of the building. Is this breakout, then, just an impressively strong arch? Or has the demolition been called off entirely?
What makes this particular Wave B so unusual is its sheer force and its decoupling from the rest of the market. Typically, these corrective waves are weak and anemic, unfolding while the broader market is stable or rising. This one is happening in reverse, showing exceptional relative strength. This is the outlier data point that complicates the neat, predictable model. The chart is telling two different stories depending on the timeframe you use, and that discrepancy is where the real risk—and opportunity—lies.
A Technically Sound Rally in a Fundamentally Broken Market
So, what’s the verdict? The data presents a paradox. The short-term technicals for Bittensor are undeniably, objectively bullish. The breakout is real. The momentum is real. The defense of key support was real. On its own island, the TAO chart is a picture of health.
But assets don't trade on islands. They trade in the context of a global, interconnected market that is currently in a state of extreme fear. Betting on a single asset to defy a systemic, macro-driven collapse is, historically speaking, a low-probability wager. Outliers are fascinating, but they often violently revert to the mean.
My analysis suggests this is one of the most convincing bull traps I have seen in some time. The strength is designed to create maximum belief in a bottom, drawing in capital from traders looking for a safe haven. While the possibility of a genuine decoupling exists, the more likely scenario is that TAO’s strength is temporary. Once the broader market finds a temporary floor and the panic subsides, the capital that fled into TAO as a "flight to safety" may just as quickly flow back out. The current rally is a testament to strong hands accumulating at the lows, but I question whether they can hold the line if Bitcoin decides to test its next major support level. The chart is beautiful, but in this environment, I wouldn't trust it.